Global Temperature Change (1970-2000)
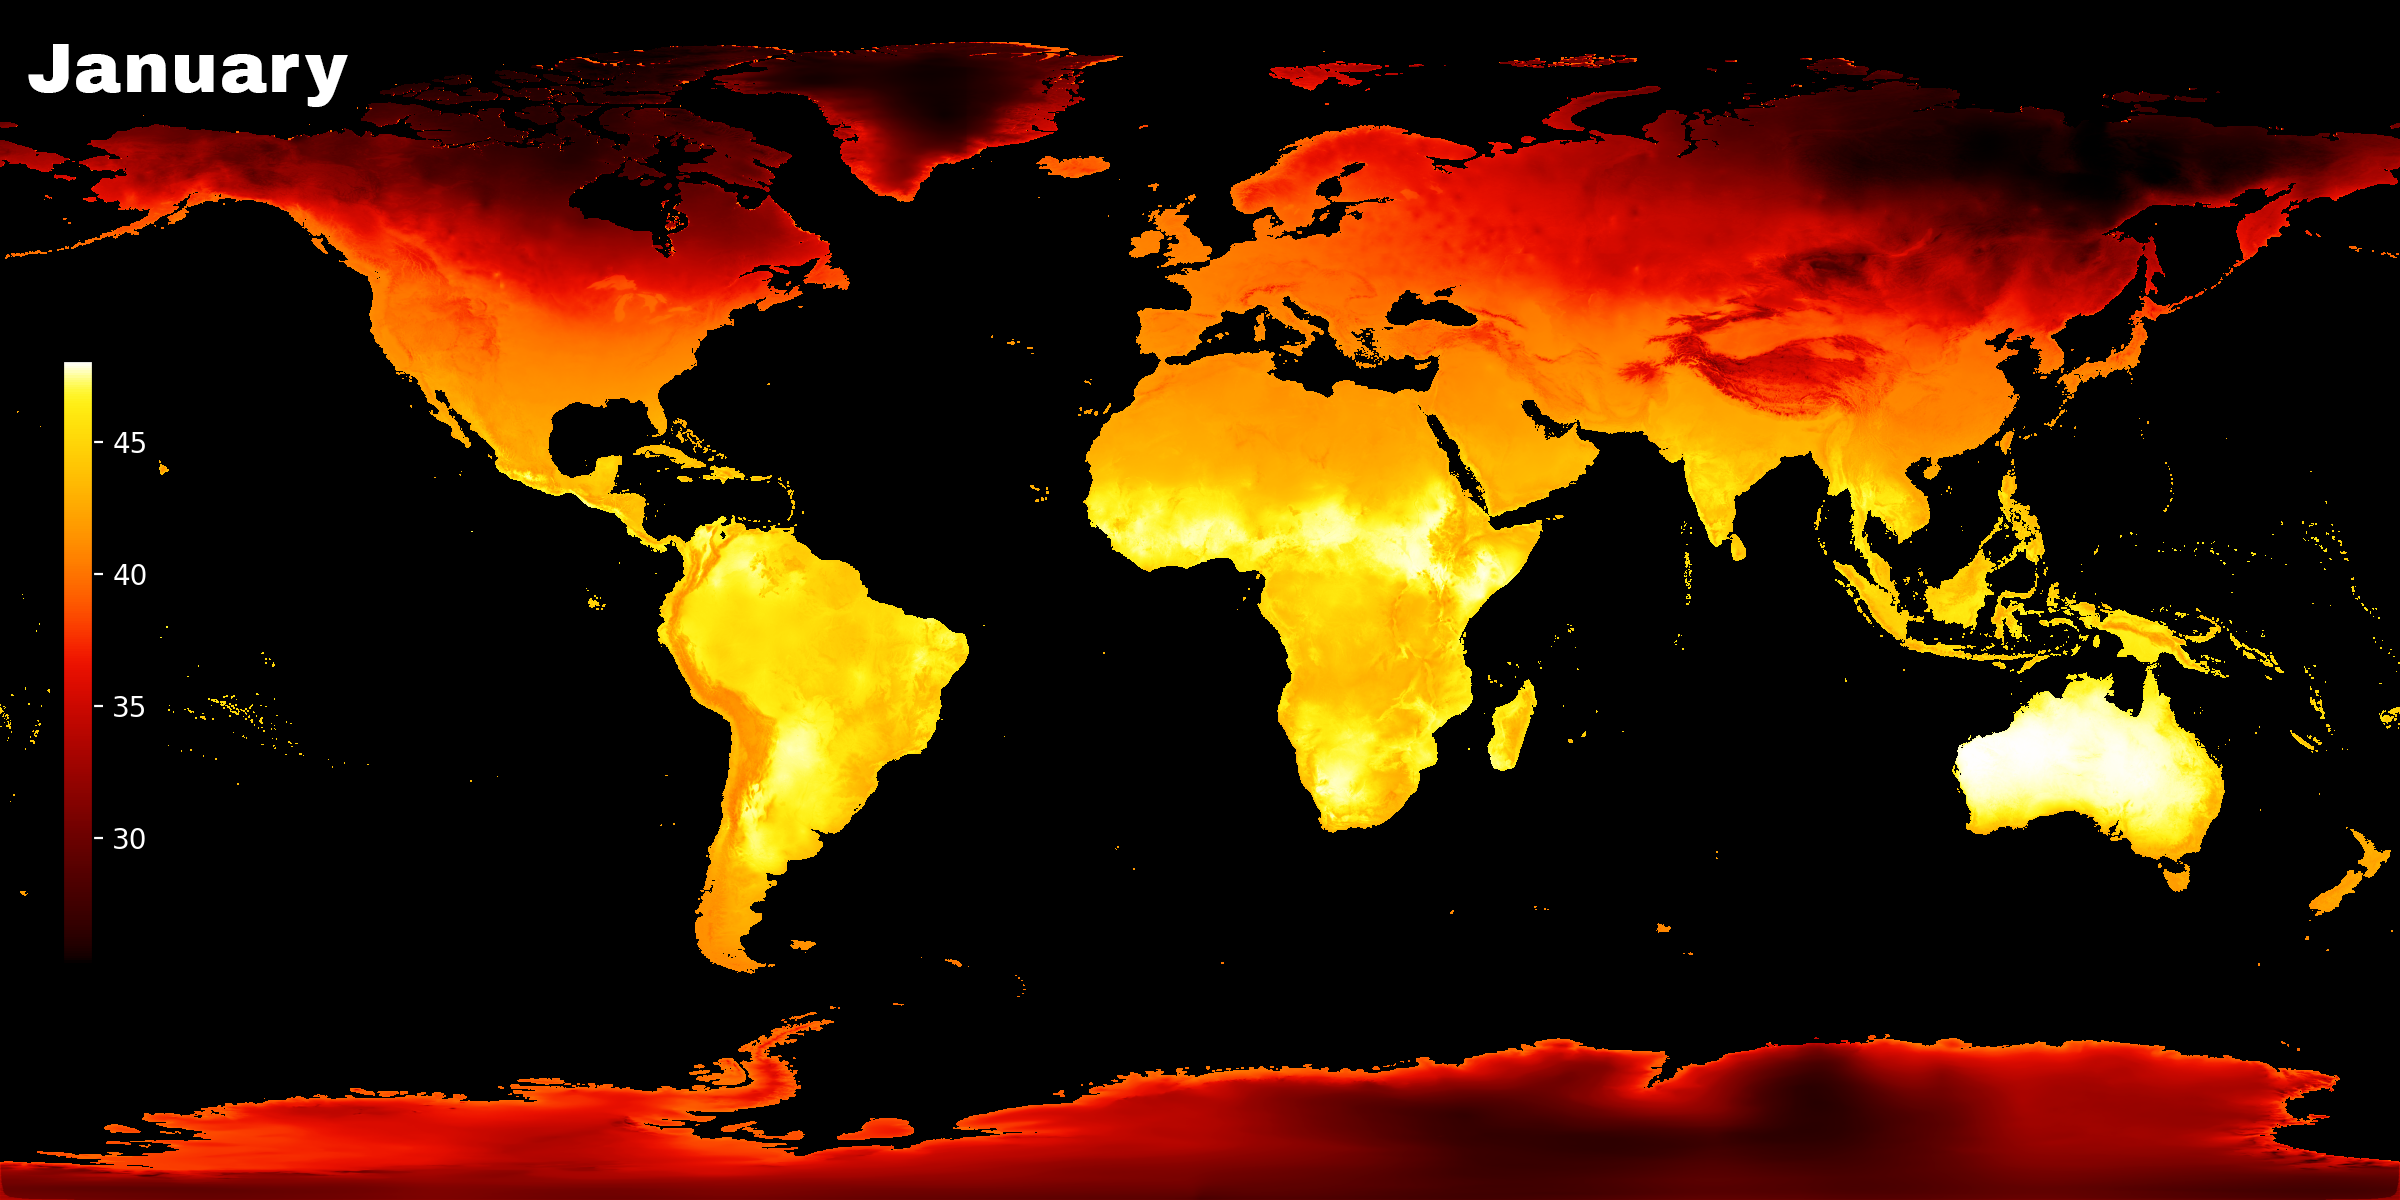
In this visual, I created actual heatmaps showing global temperature values using World Climate data:
“This is WorldClim version 2.1 climate data for 1970-2000. This version was released in January 2020. There are monthly climate data for minimum, mean, and maximum temperature, precipitation, solar radiation, wind speed, water vapor pressure, and for total precipitation. There are also 19 “bioclimatic” variables.” So, in my map, each frame corresponds to one month, using the max temperature of the WorldClim 2.1 raster dataset.
𝐃𝐚𝐭𝐚 𝐬𝐨𝐮𝐫𝐜𝐞: https://www.worldclim.org/data/worldclim21.html https://geodata.ucdavis.edu/climate/worldclim/2_1/base/
Data accessed: 2023 November 11