Grid-level Population of Budapest
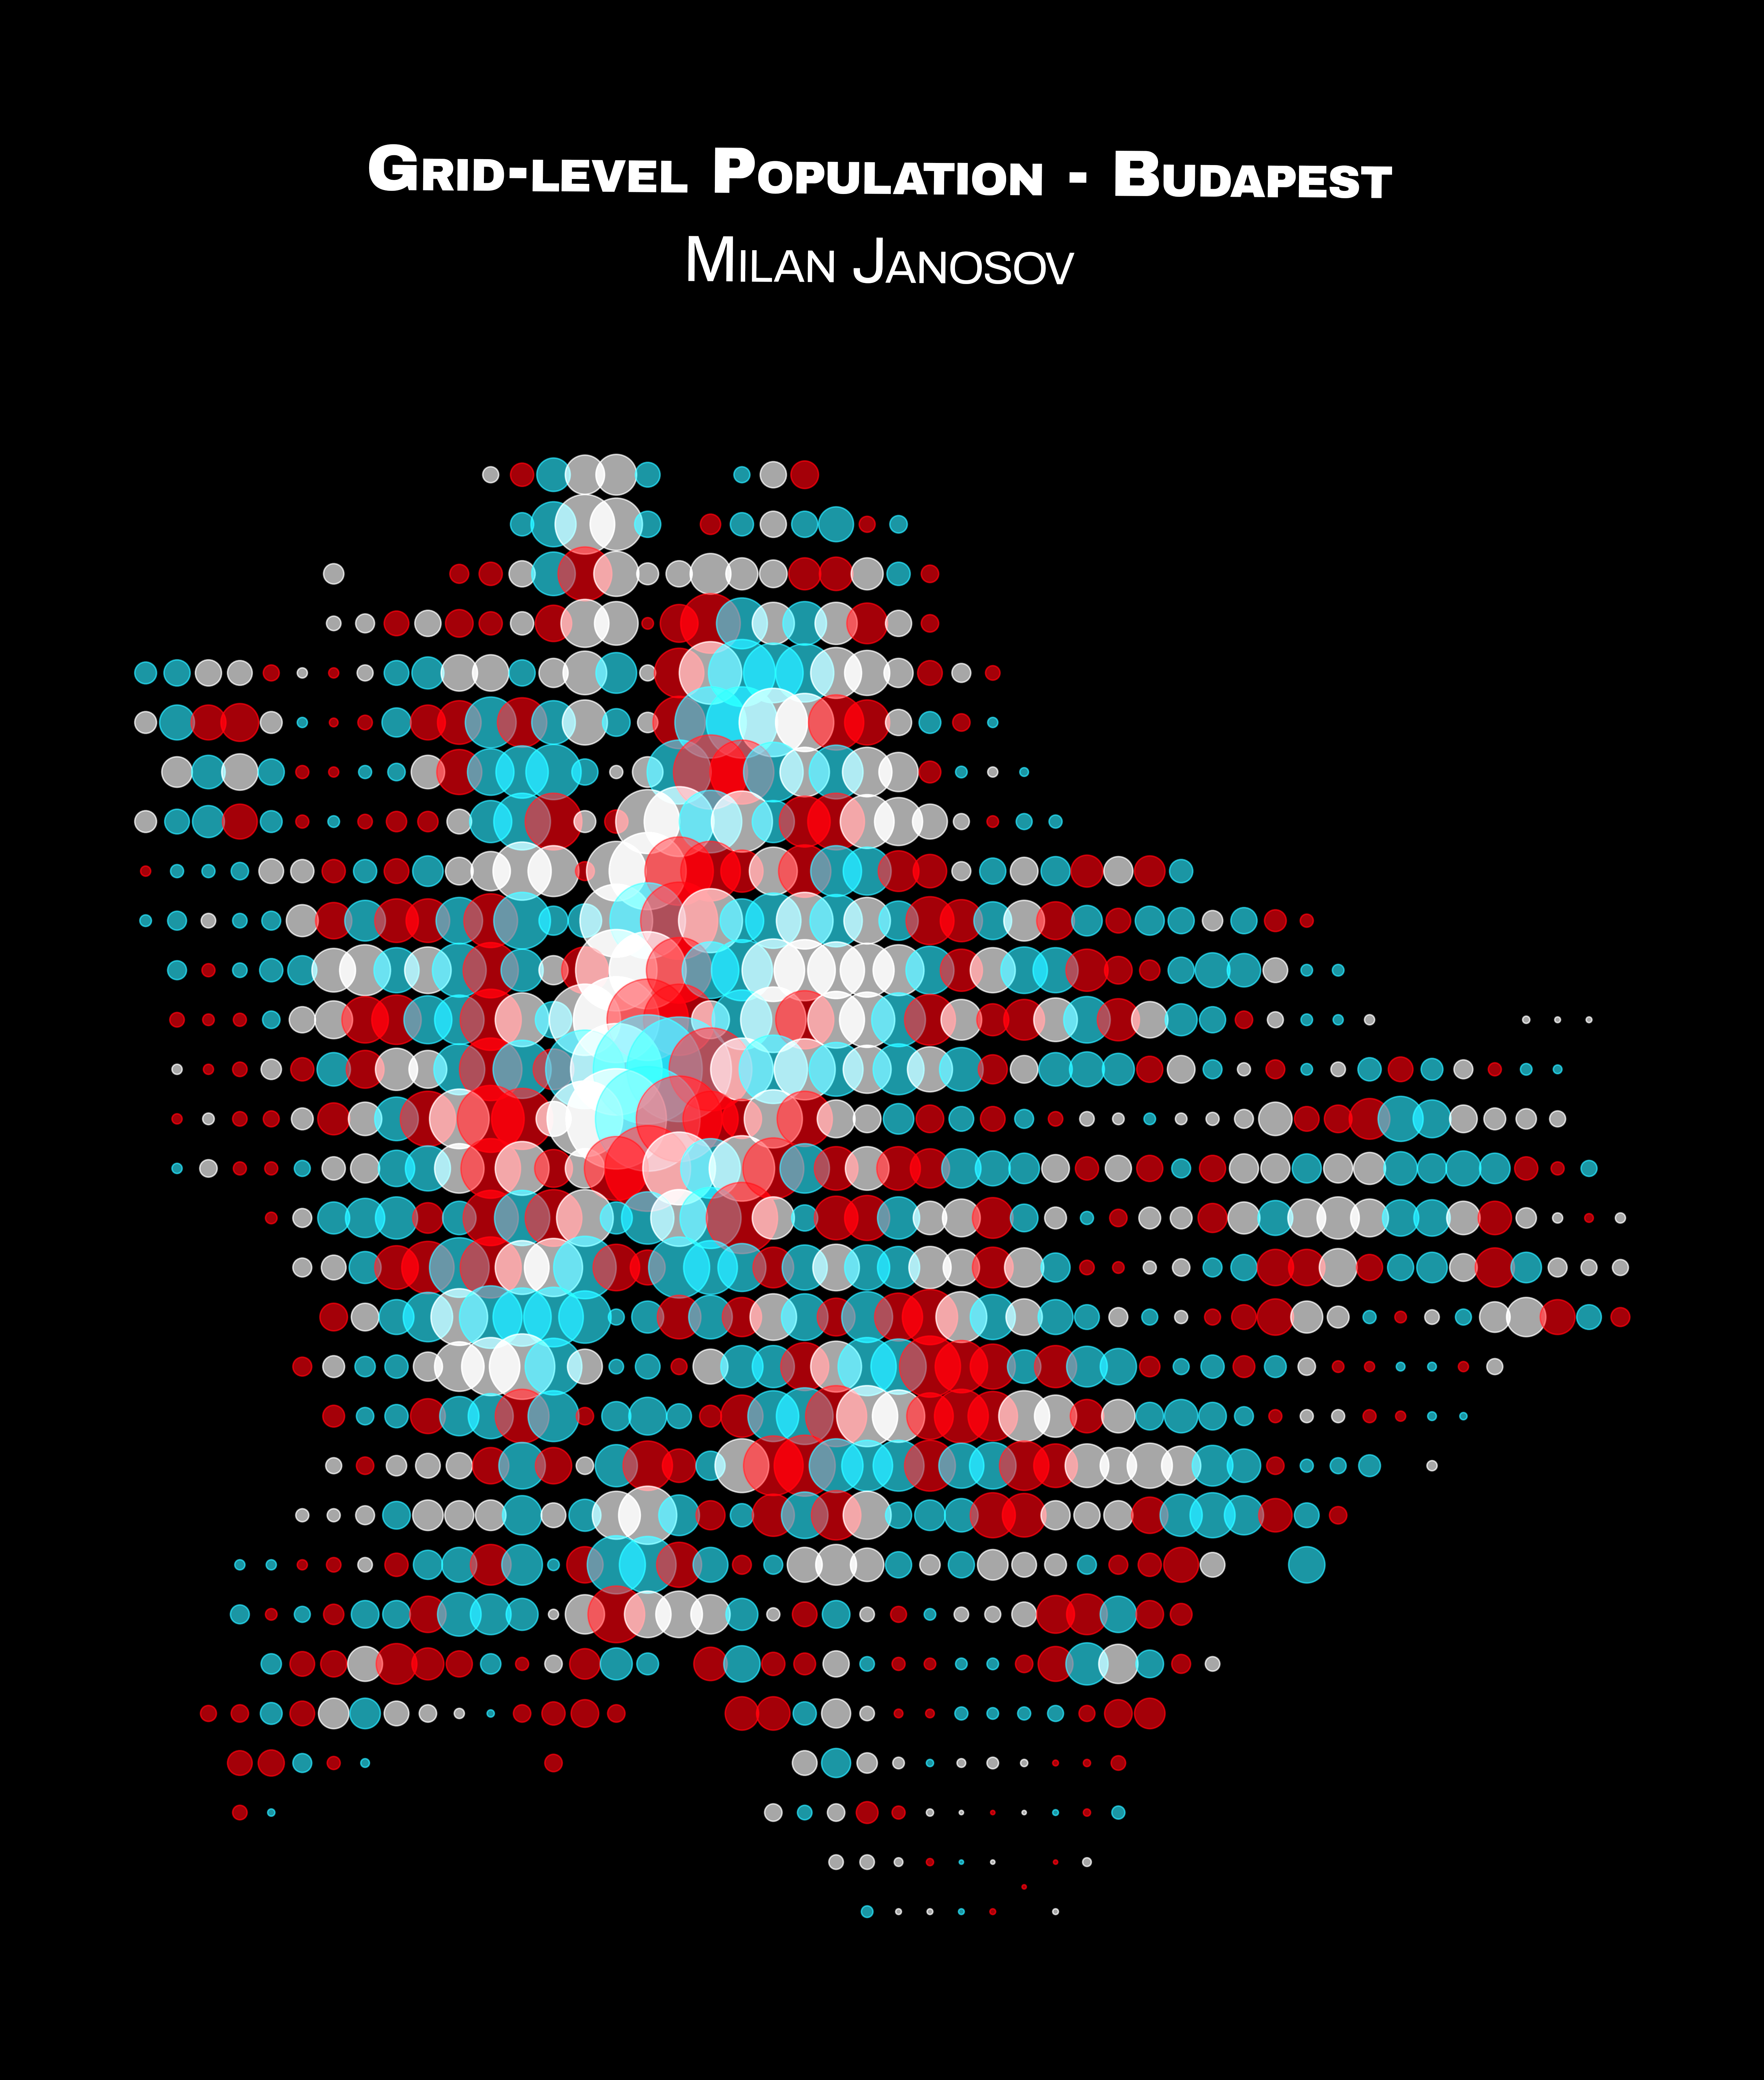
This map shows Budapest’s population levels using a different style - a dot map.
For my dot map, I again went for the Budapest Open Data Portal, which has a nice rasterised population map of Budapest (for more on population raster data, also check my tutorial on TDS)! Then, I turned each grid cell into the POI of its polygon and drew each POI with a marker with a size proportional to the number of inhabitants in the corresponding grid cell. Then, I coloured each dot red, blue, and white at random to give it this slightly old-school 3d vibe (I also have to admit, I became the biggest one of the neon red-blue colour palette this year, somewhat inspired by Star Wars).
𝐃𝐚𝐭𝐚 𝐬𝐨𝐮𝐫𝐜𝐞: https://atlo.team/boda/
Data accessed: 2023 November 11