World Map in Léo Larrivée Projection
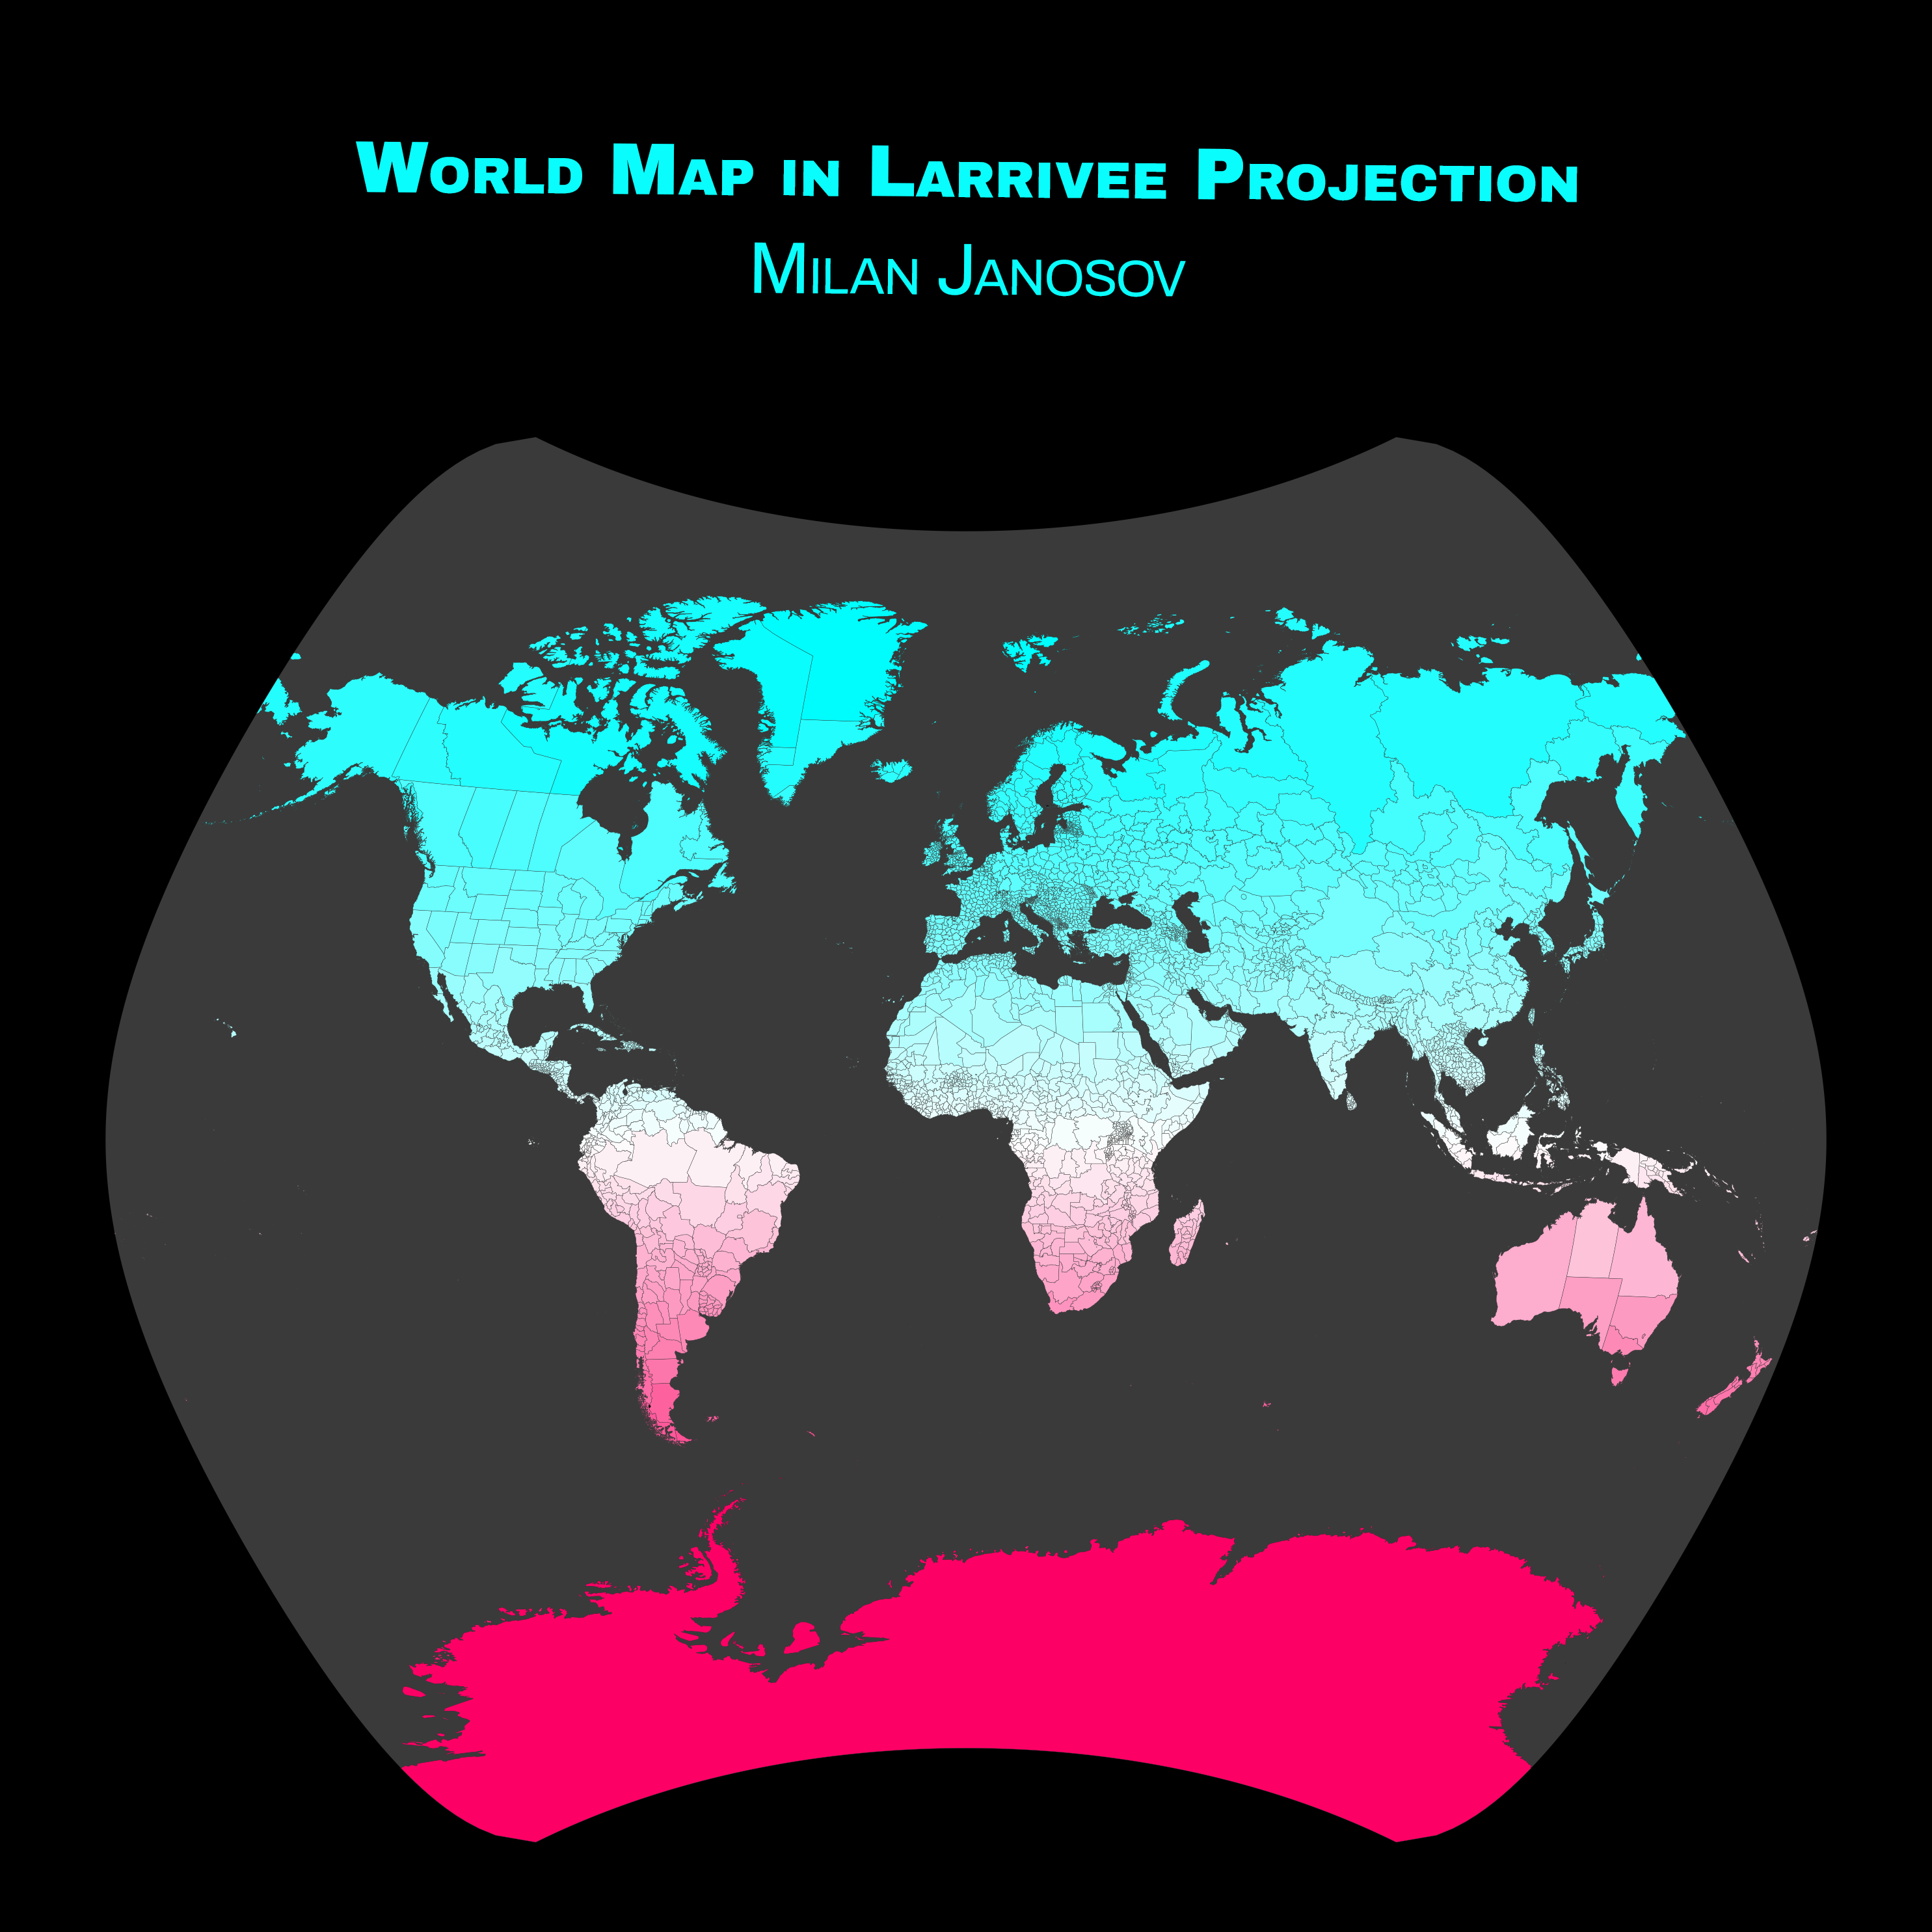
This world map shows each country as a polygon based on Natural Earth data, where each country is coloured based on its distance from the equator.
This rather unusual shape is because I used the Larrivee Projection here, which was developed by Léo Larrivée in 1988 for the Canadian International Development Agency. So far, I could only figure out that it was most likely used for remote sensing, so if you know more about the science behind this distinctive design, let us know!
𝐒𝐨𝐮𝐫𝐜𝐞: https://www.naturalearthdata.com/downloads/10m-cultural-vectors/ https://www.naturalearthdata.com/downloads/10m-physical-vectors/ https://medium.com/@janosovm/the-world-map-with-many-faces-map-projections-f58a210ff2f7
Data access: 2023 Sept 18